Table of contents
Which are the Top free performance testing tools for web apps? In this article, we will go through the different tools that can help you test your website’s performance to make sure you deliver a great user experience to your users.
Most of the time, when your website or mobile app is launched, it will be fine on its own. But eventually, users may get bored of waiting for everything to load and leave for another site.
There are tools that can help you optimize performance so users can use your app without waiting forever.
We will be using amazon.com to do simple performance tests and look at the different terms to look out for when doing performance tests.
Google’s PageSpeed module is an open-source tool for web performance. It helps you improve the page speed of any website by showing real-time scores and suggestions. You may need to remove some unnecessary scripts or styles to improve the page load speed.
Top free performance testing tools for web apps tutorial
1) chrome developer tools.
You can use chrome developer tools to check your website’s performance for free!.
Note: Open the page in incognito to avoid interference by plugins.
Step 1
a) On your browser, go to amazon.com.
b) Right-click away from any element and click inspect, and then click Performance tab on the developers tab.
c) You should now have something similar to the following page
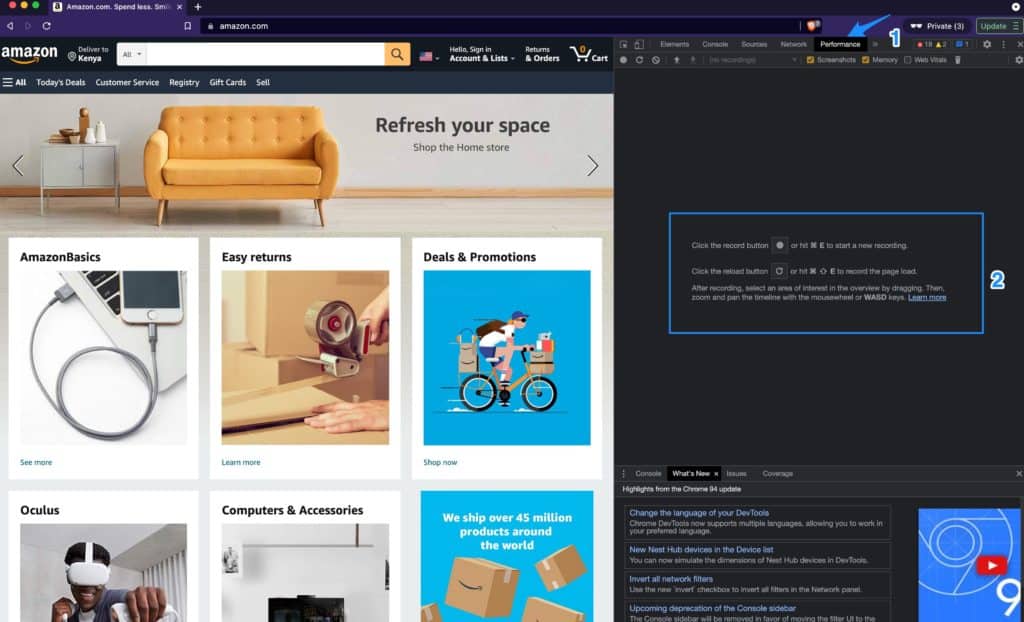
On #1, you can see the Performance tab is selected
#2, here, you can see a record button and reload button
Step 2
After the performance is complete, you will see a lot of data similar to the following
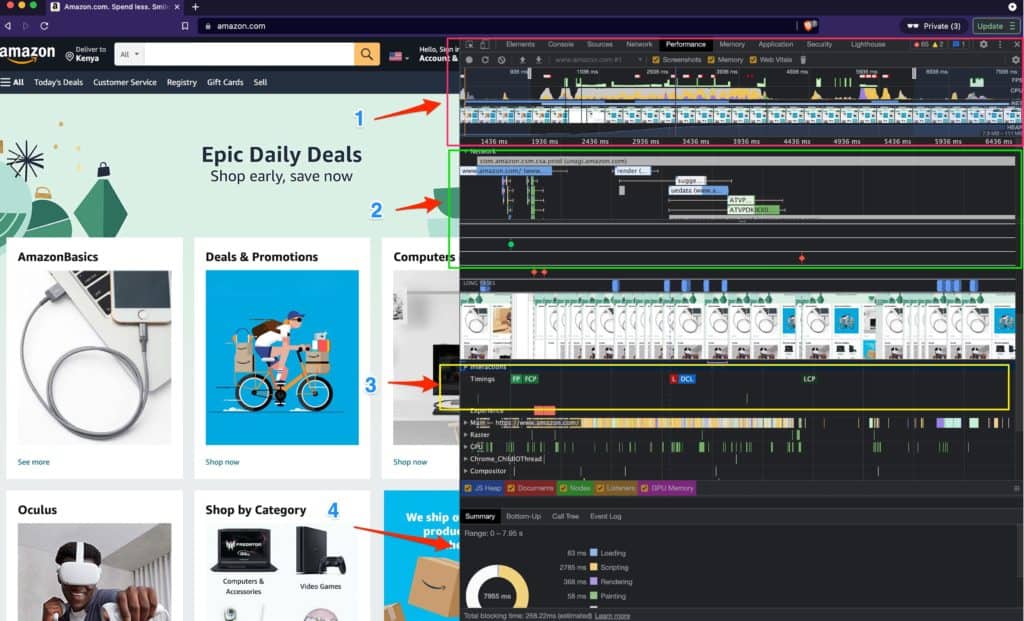
Click reload, to run a quick performance test on that page, chrome will reload and provide a lot of data on the page performance. When it starts you should see the following.
What does this all mean?
Let’s have a look at some of the data provided
| #1 This shows a timeline of how the page loads – at the bottom, there’s time in milliseconds, this time is very important as it directly correlates to how fast elements start showing on the browser | |
| #2 Network tab – shows how the amazon main page is loading | |
| #3 The timings tab shows more information about the page events. They can be defined as below. – FC(First Content) – When something loads on the page, that is, when users start seeing the page, that is considered as 1st contentful paint. This event happens before anything else on the page. – FCP(First Contentful Paint) – When a website is ready to be viewed by a visitor or when a computer application is ready for use, it must be “painted” with an initial content. A user has waited for this moment and is likely to give all their attention to the new content that they’re about to view or use. That means that if the initial paint does not happen in time, then the user may abandon his visit or use of your app before its complete. – L(Load Event) – is the moment when the browser finishes loading all resources that it needs to display a web page. – DCL(DomContentLoaded Event) – When the browser finishes loading the DOM content, this is when the DOMContentLoaded Event fires. This means that when JavaScript code starts running, after the DOM is loaded. LCP(Largest Contentful Paint) – The LCP is the largest amount of data that can be loaded on the page at one time. The LCP occurs when the L(Load Event) event happens. | |
| #4 Summary graph that shows the basic performance of the website and the time taken for each stage | |
Performing website audits
Next, let’s use chrome to perform a website audit in order to interpret them for the same website.
- Make sure the
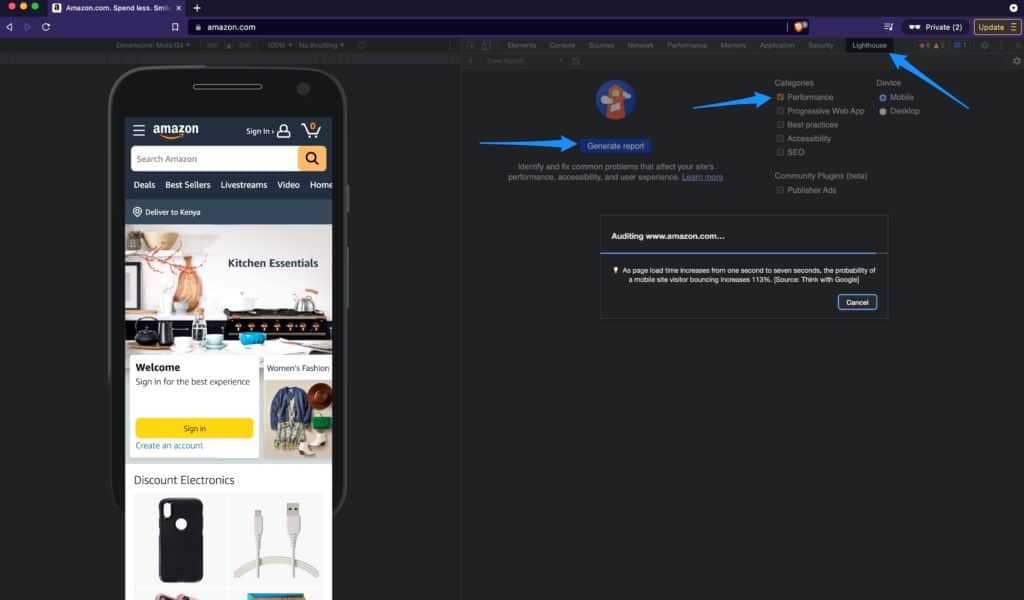
- Make sure you have selscted Lighthouse tabl
- Only check performance – as we are keen on doing performance testing in this tutorial
- Then click generate Report
Expected results
You should expect to see the results below.
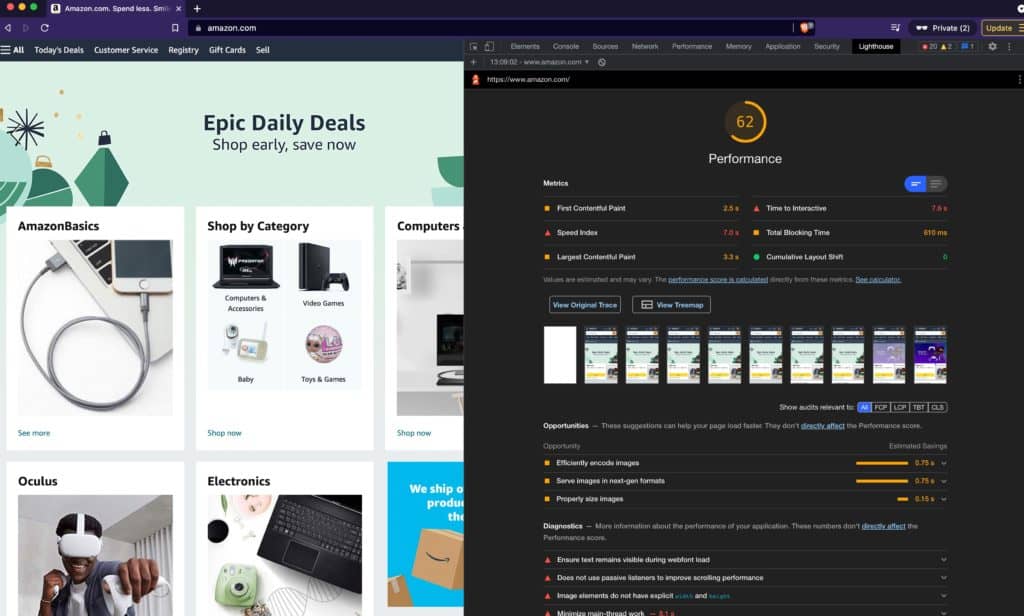
- Summary of tests by Lighthouse
- You can see a summary of Performance indicators – and as we discussed in the above diagram(Reading the performance results) – We can interpret these values accordingly.
Note: To use the Lighthouse page tool online – on google servers. You can use the tool on their official website here – All you’d need to do is to enter the URL of your website.
2) Using webpagetest.org
Webpagetest.org – is an opensource website that helps in analysing performance of a particular website.
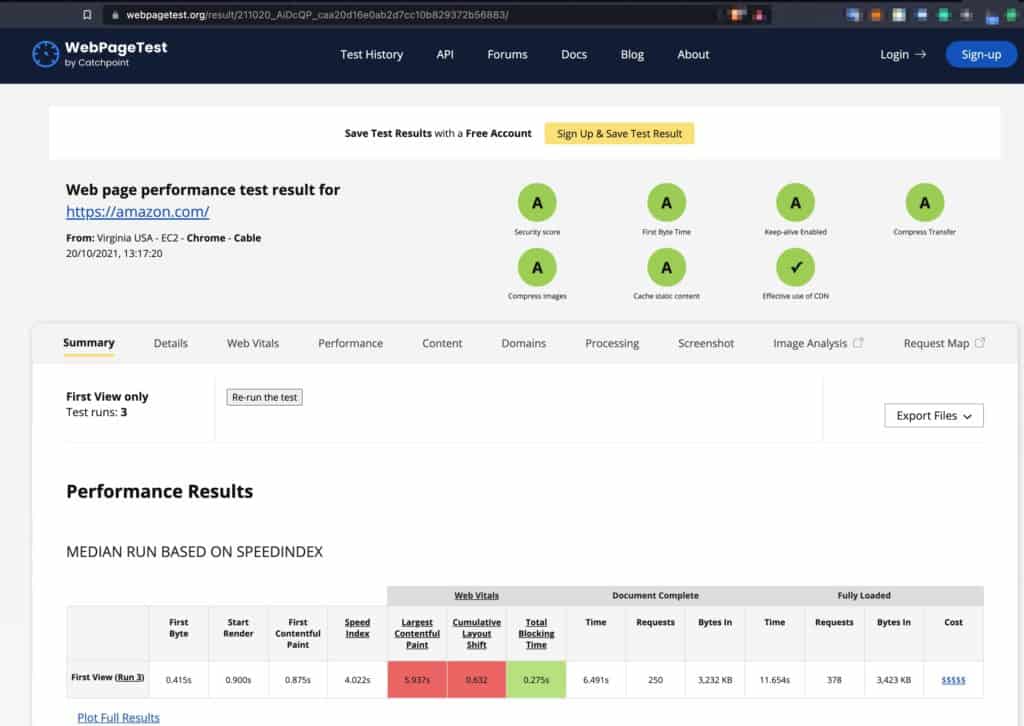
On testing for our sample webpage – amazon, we get results and if you scroll further down, you will see more in-depth results for CP, FCP and other metrics
3) Using GTMetrix.com
Similar to webpagetest above, gtmetrix is an online web analyzer tool that can be used to give results on a given website. Let us run a sample test on it as well.
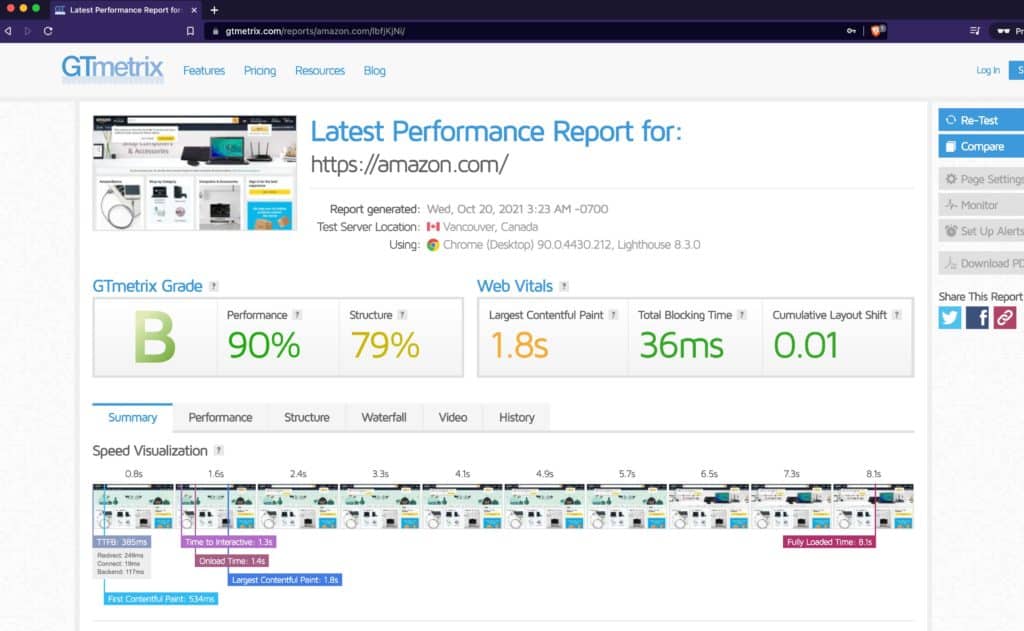
Similarly – the results can be seen by scrolling a little bit further down the page and analysing the given outcomes.
Conclusion
The high-performance tests are very important for the final release of the apps because they are an essential part of any website or application. If your app is not able to deliver what you want them to have, you will be able to come up with a solution that will help to improve the performance of your app.
Read here to see an interesting article about the difference between load testing and performance testing.

