Table of contents
Let’s look at what debuggers are and how to use debuggers to test software. Debuggers are a programming term used to identify a tool that gives programmers the ability to examine the state of their software while they are still working on it. These tools can be used by different developers at different stages, so it’s important for you to know when and where debuggers should be utilized in software QA. Read on for tips on how to use them effectively!
Debuggers can provide an invaluable source of insight into the code being produced. Designers and QA engineers often work with different parts of a product and therefore knowing which code is responsible for any given aspect will help with faster development as well as future assurance testing.
How To Use Debuggers to Test Software
Use debuggers in the following ways:
• When you have an issue, look for the call stack in your debugger. The call stack is an ordered list of functions that has been executed, and can give you a quick look into what part of your program is causing the problem. For example, if you’re creating a new textbox and it’s not displaying as expected use your debugger to find out which line of code took you there. This can help make sure that testing on this section of code did indeed produce actual behavior expected by your users.
• The state of your program can be an indication of how stable it is. If you can’t see a problem for yourself, look for the state of your program and try to see if it matches what you expect to see or not. For example, if the debugger indicates that an image has been loaded but it’s not displaying properly, check to make sure the image does in fact load when you test the app.
• Use debuggers as an aid to help with large scale testing projects. If you have a large project that needs a large amount of manual testing, debuggers can be used to isolate bugs as they are found while also providing more information about what caused them.
Use debuggers to help you with smaller R&D/design projects where there are a lot of bugs to fix. It’s not that testing doesn’t have its place; more time spent on bigger projects will lead to faster development cycles, which will result in better products in the end. However, if you’re responsible for a smaller part of the project (e.g. tests) and find a bug that wasn’t caught by QA or test automation it may be easier to find than if you’d gone into production with it already.
Using the step
One useful method for getting your project into the hands of your QA department early is with the use of a “step” debugger. This type of debugger allows you to step through code one line at a time. This allows you to see what happens in between two lines when it’s supposed to go from one to the other.
Partial Steps
Often, you may want to get through certain sections of code faster, so if you can’t get full pauses in execution this can be useful. These are called partial steps, and will simply skip over certain sections that are not needed to move the application forward. This can also be useful for skipping over code you think may get in your way.
Macro Debugging
This type of debugging allows you to pause program execution and change the state of your application to either look at different aspects of the application or add different variables and values into it. This is helpful if you need to test a number of different applications at once while they’re running.
Remote Debugging
If you have a QA team that is offsite, this can still be used in conjunction with them by allowing them access to view information regarding processes and variables that are stored within your code.
Example:You know that the only units your program needs to work with are inches, but during testing you find that the program is telling users to input feet. If you were working with a step debugger, you’d be able to drill down into the code and find out if there was an error or if certain conditions are entered in order for this bug to appear.
Debugging Delays
A debug delay is utilized by a lot of software designers because it’s easy to set up and doesn’t usually slow down execution time, yet it’s extremely effective at showing your QA team what code has been executed before they arrive at any errors so they can spend more time on what they really care about.
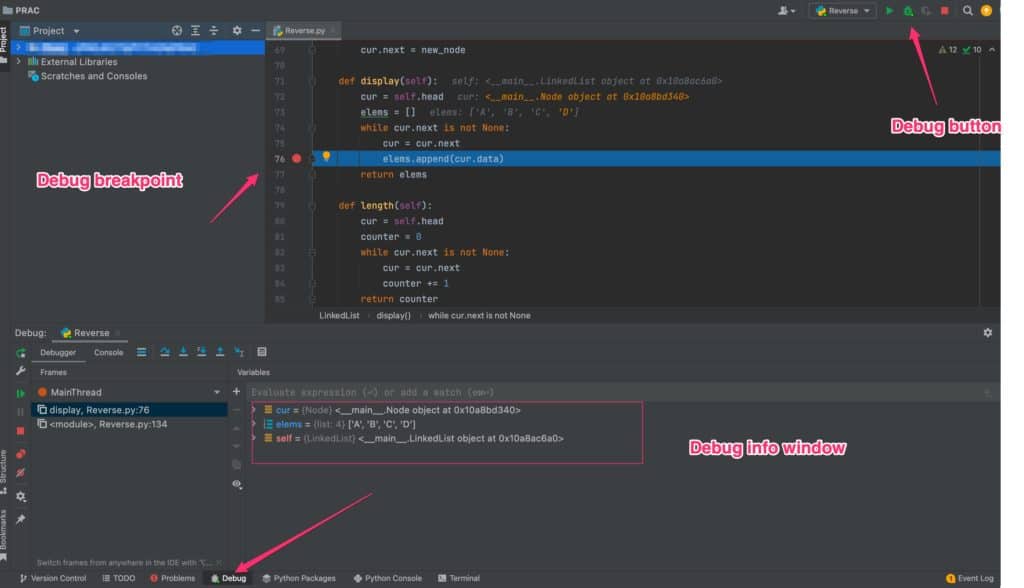
Example debugger in PyCharm
In Pycharm, the debugger’s window is displayed automatically when a breakpoint, an exception or a log message is detected.
Each debug instance has its separate debugging toolbar, which allows you to switch in and out of debugger mode, run the application step by step, evaluate arbitrary expressions and examine variable values.
The Console tab displays the output of print() statements, as well as exceptions and messages. If the Console tab is absent, click on the icon next to the variable list to open it.
The variable list shows local and global variables that are currently in scope. Every time you click on a variable name in the list, its value will be displayed in the bottom-left pane.
An opportunity to run code without executing it immediately. This can be useful if you want to perform any preprocessing or other operations before you start a debugging session.
The debugger is initiated from the toolbar with a context menu on function calls and breakpoints. With the open statement, you can seek to any location before execution begins; this is commonly used for finding outer scopes that are not yet created, or for automatically stepping over generated code. The continue statement does not repeat programs execution step-by-step, but instead returns control to the breakpoint that was previously set at that point (if any).
Conclusion
Debugging is a crucial part in the software development life cycle. Debuggers allow developers and designers to have a better understanding of the code they create because they can see what parts of the application are causing errors and fix them before anyone can notice them (except for the user).
While debugging, developers utilize a variety of different types of debuggers, which vary in usability and difficulty to set up. QA engineers use their step debugger more often than not as it’s very user-friendly.
You might be interested in Why Do We Need QA Testing